
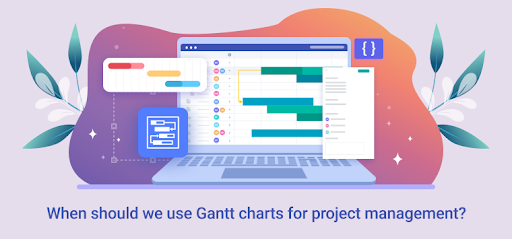
No matter how experienced you are in software development, you must have heard of Gantt charts. These diagrams may seem complicated at first sight, however, they are priceless tools in project management. In this overview, we will focus on the benefits of Gantt charts, what developers can get utilizing them regularly, as well as provide examples of worthy solutions currently on the market.
What is the Gantt chart?
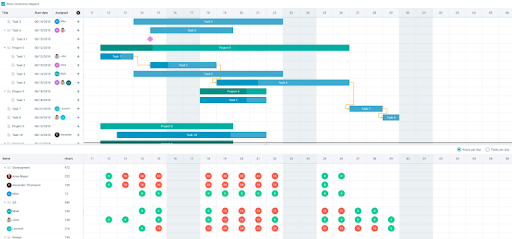
In a nutshell, it is a means of visual rendering of the project progress. It makes the development process more understandable and clear, so it may be used both with small projects and huge ones, with several teams working in cooperation. The graph shows planned activities for specific days and times. The start and end dates are also shown on the chart, so it is used by team leads and members.
Who is Mr. Gantt?
The first similar chart appeared in 1896 and it was developed by a Polish engineer, economist, and professor Karol Adamiecki. Unfortunately, the tool doesn’t have the name of its first creator as Mr. Adamiecki published his research in 1931 and only in Polish. Henry Gantt, an American mechanical engineer and management consultant designed his chart between 1910 and 1915. At that time, the chart was used to measure the performance of the employees and track them under- or overperforming. Early Gantt charts were drawn on paper and the bars were adjusted manually. With the introduction of computers, Gantt charts have become more complex and elaborate. Today, they are still being improved and new functions are being added.
What is good about Gantt charts?
Gantt diagrams show the beginning and end of any project, tasks duration, task allocation, a combination of various tasks. Automatic algorithms perform all the calculations and complex processes, so a person with any role in the project can build a tasks list and enjoy the results. The benefits of the tool are the following:
- progress awareness
- better communication and cooperation in a team
- perfect time management
- tracking task dependencies
- team motivation
- better flexibility
As we have already mentioned, Gantt charts appeared on paper. So, anybody can use the method to visualize any activities and tasks. You just need to know the initial date, when you plan to start working, and allocate some days for the project. On the picture, it is shown with horizontal bars. Each new task is a new bar. Thus, answering the question in the headline, Gantt charts can be implemented at any stage of a project, be it a complicated IT product, or a daily routine for the following month.
As for solutions for teamwork, let’s make a list of the most popular and convenient projects.
Which software is worthy?
There is a lid for every pod, they say. Every Gantt solution on the market has its pros and cons, its followers and opponents. Let’s make a list of the strongest to our minds.
TeamGantt
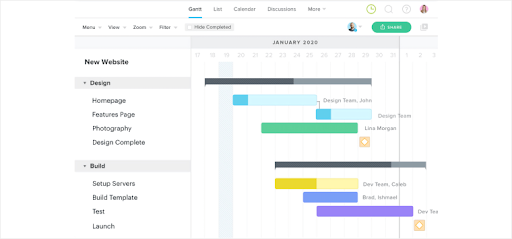
This is a cloud-based free solution. Drag and drop functionality allows one to easily move and assign tasks. The tasks can be viewed as a to-do list, calendar, weekly digest, and a Gantt chart. Resource management and capacity planning features allow users to calculate costs.
ClickUp
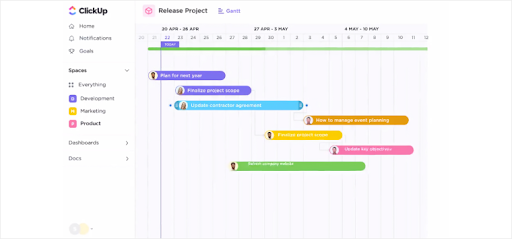
Another free solution on the list with a high rating. This one is popular because of its full and robust functionality. First, it allows assigning tasks to multiple team members and even whole teams. Second, the convenient sorting function and progress percentage add value to the project. Third, milestones and time tracking contribute to the general impression of this tool.
GanttPro
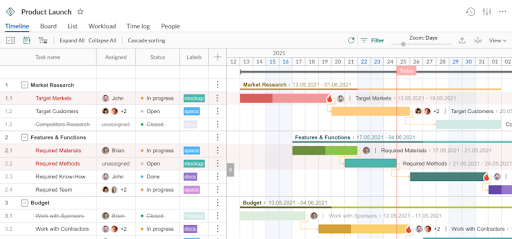
This product is not free, but it offers a free trial period. The solution provides customization of the working days with an automated calculation of the project duration. Board view allows seeing the tasks allocated on small cards in relevant columns, which makes it similar to the Kanban board. Besides, any task can be commented on and connected to an attachment.
Webix Gantt Chart
This is a product from the Webix UI Library. It is a so-called complex widget, that serves as a complete single-page application. Those SPAs can operate independently or be built into any environment. Apart from traditional functionality, the widget allows marking the scales of the tasks, showing the critical path of the tasks, i.e. those tasks, that cannot be postponed. The library is noted by the users for its responsive and highly effective support and lively forum.
Conclusion
As with any other software solution, there is no problem in finding a convenient tool. There might be a problem with meeting the expectations. So, it is always a good idea to think carefully about what exactly you would like to get with a solution, which issues you want to deal with the help of it. This will affect your choice, how powerful and complex a tool you need.


